
National exposure data is an evidence gap
Workplace health and safety and workers’ compensation data plays a critical role in understanding and mitigating risks faced by workers across Australia. However, to create a complete picture of work-related injuries and illnesses, we need a range of data sources, especially at the earliest stages of risk, or exposure.
The pyramid diagram (by Carder et al. 2017) below provides a framework for thinking about work health and safety monitoring. It shows different levels of impact of work-related injuries and illnesses – from the lowest level (exposure) to the most serious (fatality).
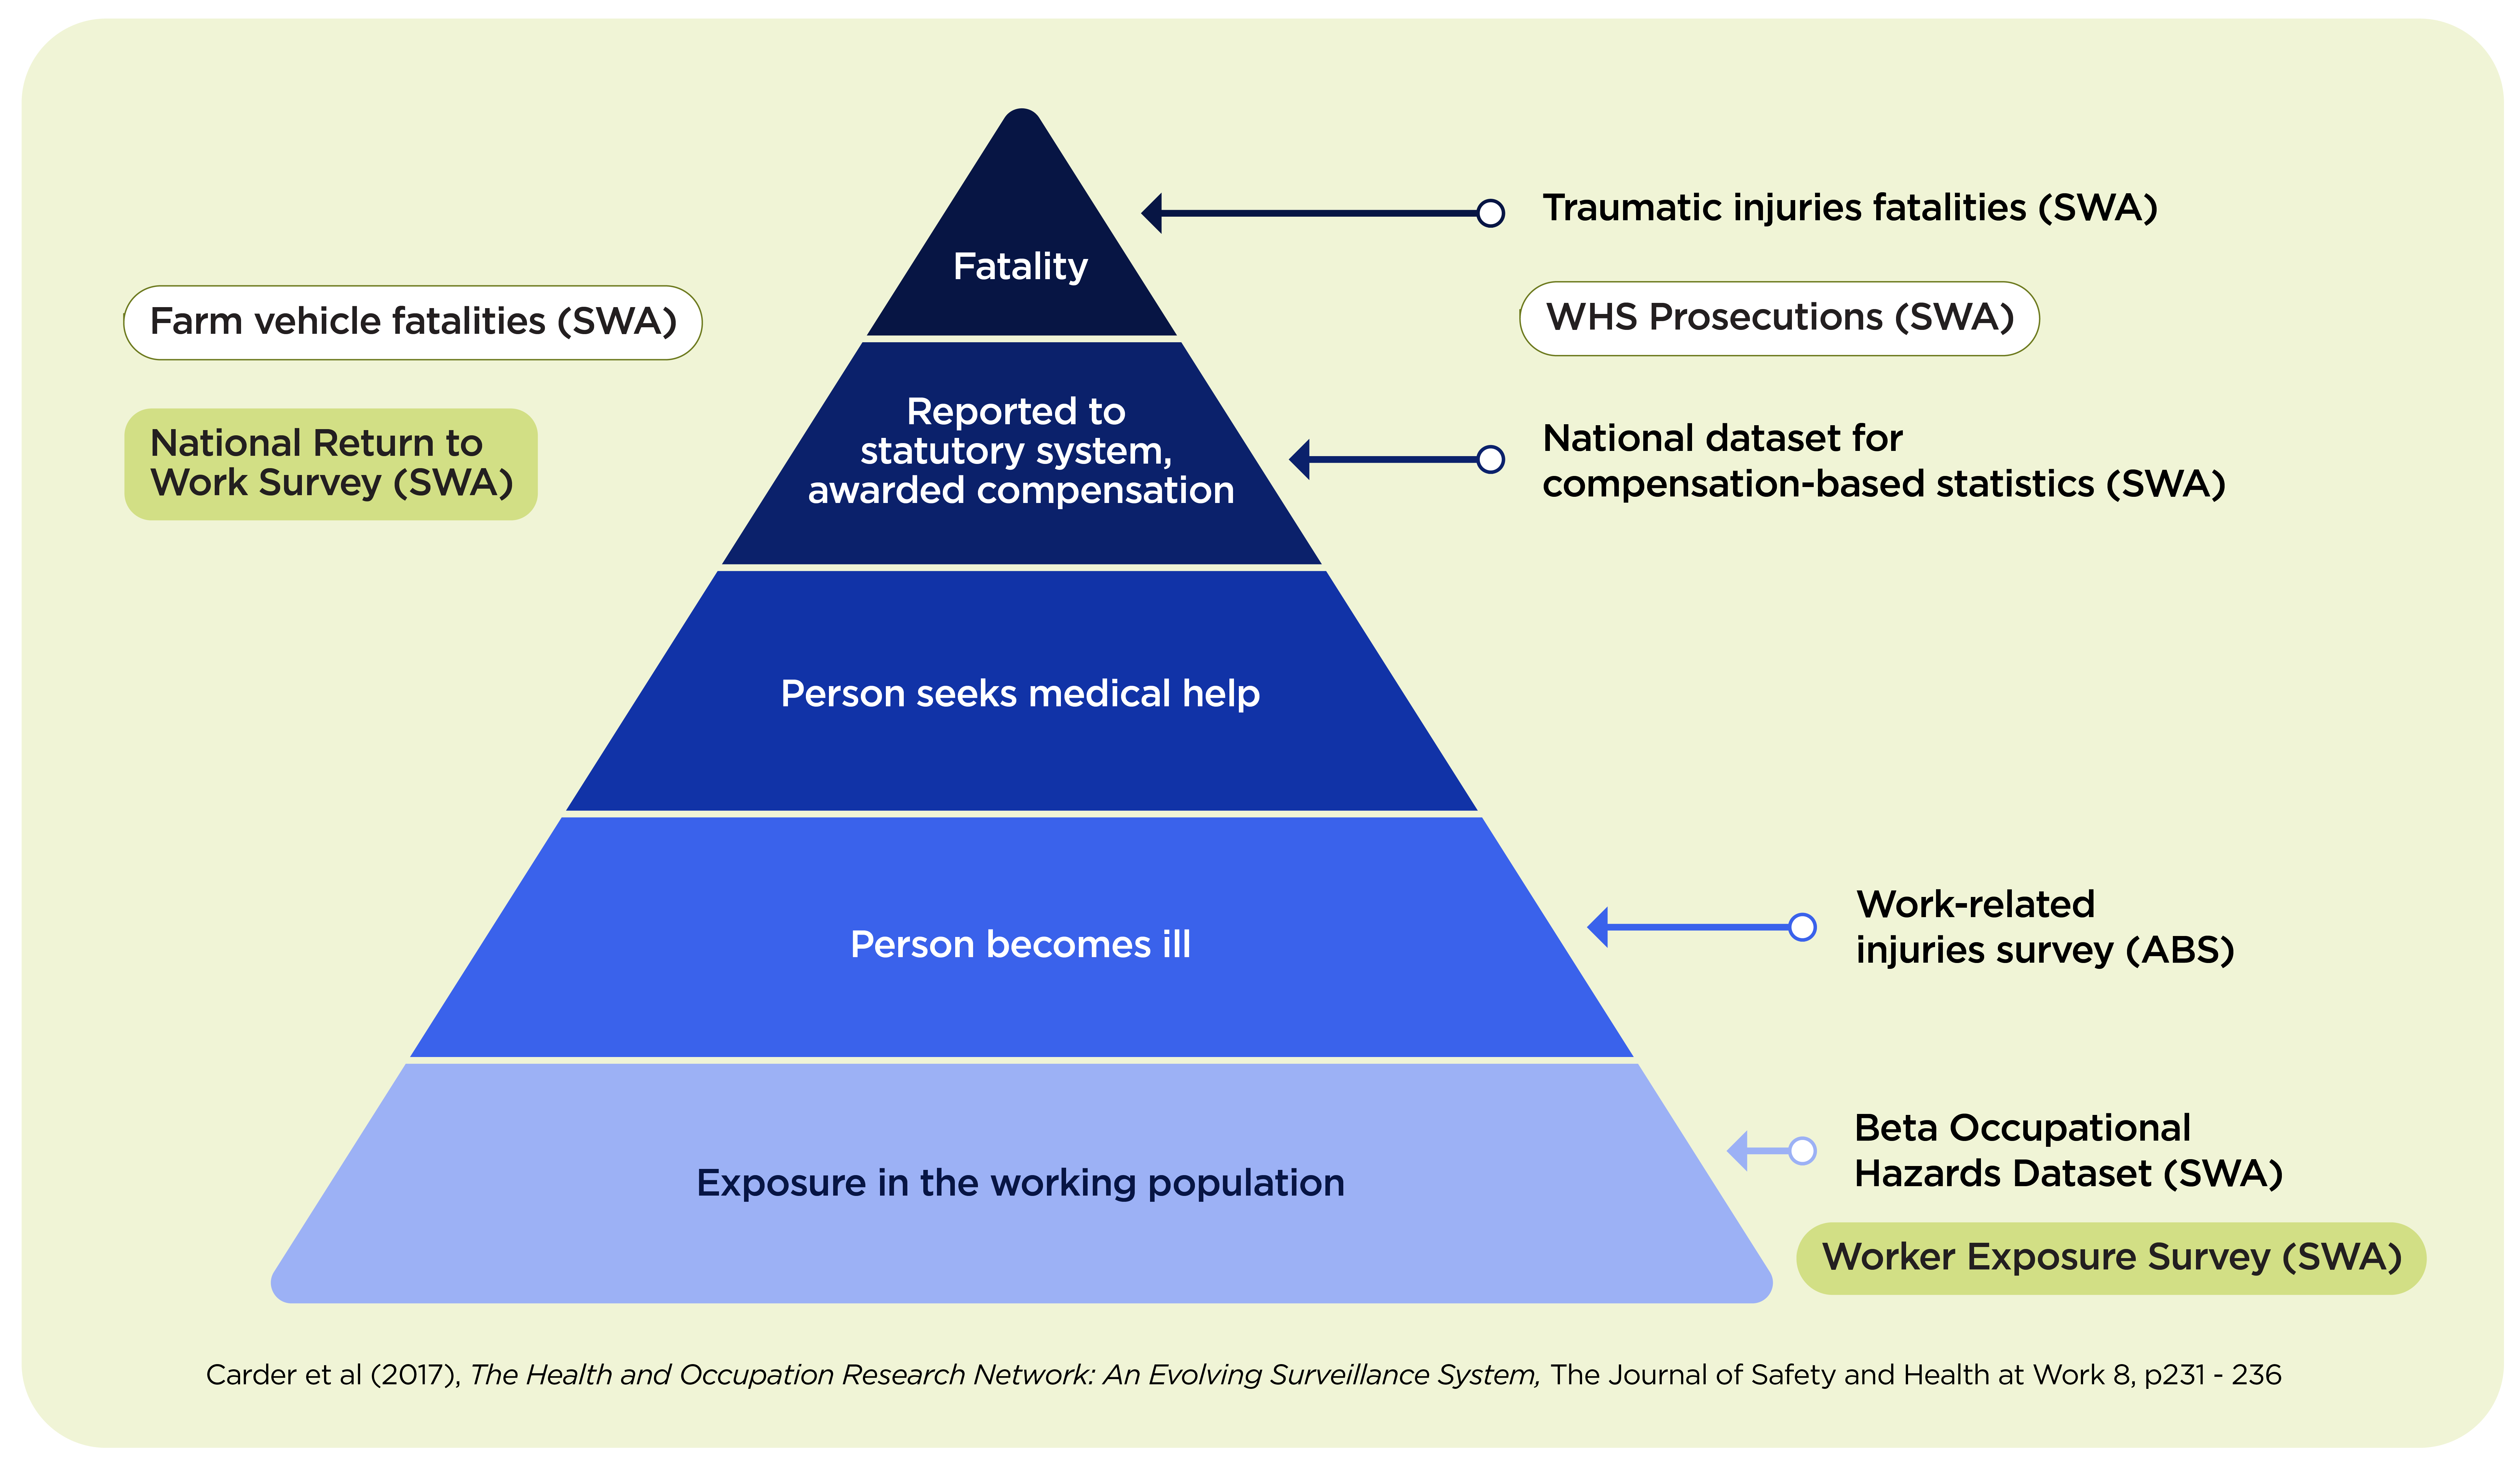
Source: Adapted from Carder et al (2017), The Health and Occupation Research Network: An Evolving Surveillance System, The Journal of Safety and Health at Work 8, p231-236
There are different data sources available for the different levels of impact in the pyramid, which enable us to understand the many elements comprising our WHS monitoring system.
In general, the higher the level of the pyramid, the more severe the outcome from exposure to a work-related hazard – and the fewer people that are affected. Available data is largely more detailed and frequent for people represented in the higher levels of the pyramid. For example, more detailed data is available on workplace injuries (through workers’ compensation claims) and robust detailed data on workplace fatalities. Conversely, the bottom level of the pyramid represents all workers who have been exposed to a hazard, and, at this level, data is generally quite limited.
Beta Occupational Hazards Dataset
The Agency’s Beta Occupational Hazards Dataset, released in 2023 provides a unique source of exposure information. It is based on data from the United States’ O*NET program, a continuous survey of workers, employers and occupational experts. The O*NET program collects information about the nature of work undertaken in different occupations and measures the relative exposure of jobs to different types of hazards.
Safe Work Australia integrated this O*NET data with the Australian classification of occupations (ANZSCO) and also integrated workers’ compensation claims data and ABS employment data to create the Beta Occupational Hazards Dataset. The combination of these variables in one dataset allows users to explore the relationships between job characteristics (including relative exposure to a range of job hazards), workers’ compensation claims and employment levels.
In September this year, the Agency released a new hub and 3 dashboards based on this data. The new dashboards allow users to explore the Beta Occupational Hazards Dataset:
- by hazard – showing which occupations are most impacted by specific hazards
- by occupation – revealing the types of hazards associated with a particular job, and
- using a chart customiser – enabling users to create tailored visualisations based on their specific interests.
‘These dashboards help users to interact with the Beta Occupational Hazards Dataset and learn more about the job characteristics that are associated with work-related injuries and illnesses. Users can build their own charts to compare different hazards and occupations.’
Australian Worker Exposure Survey
To build on this work, Safe Work Australia is developing the Australian Worker Exposure Survey which will provide updated data on workers’ exposure to dangerous substances and psychosocial hazards.
The last worker exposure survey was conducted in 2013. In 2024, the Agency consulted with work health and safety experts to shape a new exposure survey. This new worker exposure survey will reflect the unique exposure circumstances and working conditions across our labour market.
The survey is currently in its pilot phase and on track for completion in 2026. It has been designed to be representative of the Australian workforce and will be able to provide estimates of the working population that are exposed to each type of hazardous agent.
The survey covers a selection of priority exposures that include:
- dust and airborne contaminants
- welding fumes
- diesel particulate matter
- chemicals
- dermal irritants
- shift work, and
- heat stress.
Notably, the survey also includes a specialised module on mental health hazards, based on the model Code of Practice: Managing psychosocial hazards at work. The survey will explore how these mental health hazards intersect with other exposures and hazards.
How do you measure exposures?
Measuring exposure to dangerous substances through a survey is difficult, as workers are unlikely to know the extent to which they’re exposed to a particular agent or chemical. To address this, workers will instead be asked about the tasks they do every day in their job. Data analysis converts this information into a likelihood and level of exposure to the hazard.
To enable this unique approach, Safe Work Australia is using OccIDEAS (Occupational Integrated Database Exposure Assessment System) – a web-based survey application designed to assess a worker’s exposure to various hazards. OccIDEAS applies special algorithms, developed by a team of experienced occupational hygienists and epidemiologists, to convert the information on workers’ tasks into information on the likelihood and level of exposure.
Subscribe to our mailouts for updates about our data.